Mapping Coronavirus
With the recent worldwide crisis regarding the Coronavirus I thought it appropriate to develop a little mapping app to help visualise the virus spread. Every time there is some sort of crisis I always think it would be handy to have something to map such incidents. So this time I thought I would actually knock something together.
To undertake such a project you basically need 3 things: Some sort of mapping service, a data source regularly updated and a geocoding service.
Mapping Service: Leaflet.js

In the past I would have simply gone to Google Maps, but these days it's a little bit trickier without paying and putting your credit card details with them.
My Google Maps replacement is Leaflet which is based on OpenStreetMap's mapping data. Setting up Leaflet is straight forward. Include the js and css files on your page:
<link href="https://unpkg.com/[email protected]/dist/leaflet.css" rel="stylesheet">
<script src="https://unpkg.com/[email protected]/dist/leaflet.js"></script>
Then add the js code to create the map on your page:
//assuming your html map element has an id called "map"
var map = L.map('map').setView([20, 13], 2);
L.tileLayer('https://{s}.tile.osm.org/{z}/{x}/{y}.png', {
attribution: '© <a href="https://osm.org/copyright">OpenStreetMap</a> contributors'
}).addTo(map);
This will put a map in your html element with the id of "map". The first parameter of setView is the lat/long of the centre of the map, the second the zoom. [20,13],2 will give you a world map view.
To put some sort of marker on the map indicating where a coronavirus outbreak has occurred we need two sources. One for the virus data and one for the coordinate data.
Virus Data Source: RapidAPI
This is what I used for the virus data. Whilst the WHO does have some sort of data feed, I couldn't find a Coronavirus feed. So I thought it simpler to just go to RapidAPI. The source of their data comes from the John Hopkins University, in particular their GitHub repository at https://github.com/CSSEGISandData/COVID-19.
Once you sign up for an API key at https://rapidapi.com/, you just make a call to the API url and it returns the data in the following format:
{
"error": false,
"statusCode": 200,
"message": "OK",
"data": {
    "lastChecked": "2020-03-21T05:02:35.635Z",
    "covid19Stats": [{
            "province": "Hubei",
            "country": "China",
            "lastUpdate": "2020-03-20T07:43:02",
            "confirmed": 67800,
            "deaths": 3133,
            "recovered": 58382
        }, {
            ....
When I say a "call to the API url" you also need to pass two headers with your call, one of which contains your API key. In jQuery it's like this:
let opts = {
    headers:{
        "x-rapidapi-host" : "covid-19-coronavirus-statistics.p.rapidapi.com",
        "x-rapidapi-key": "YOUR-API-KEY"
    }
};

let url = "https://covid-19-coronavirus-statistics.p.rapidapi.com/v1/stats";

//call the API
$.ajax(url,opts).done(function (data, status) {
    //do something with the returned data
});
In PHP it would be something like this:
$curl_h = curl_init("https://covid-19-coronavirus-statistics.p.rapidapi.com/v1/stats");

curl_setopt($curl_h, CURLOPT_HTTPHEADER,
    array(
        "x-rapidapi-host: covid-19-coronavirus-statistics.p.rapidapi.com",
        "x-rapidapi-key: YOUR-API-KEY"
    )
);

curl_setopt($curl_h, CURLOPT_RETURNTRANSFER, true);

$response = curl_exec($curl_h);
Geocoding: OpenCage
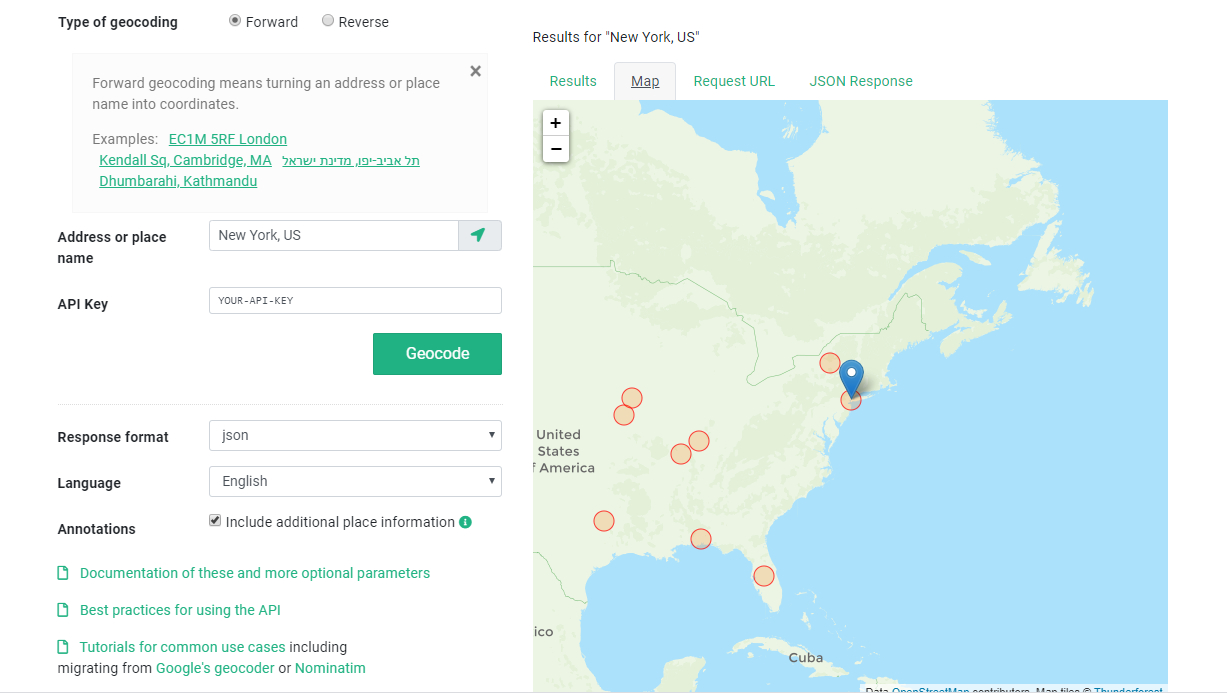
Geocoding is the assigning of the coordinates to some sort of address. The data from WHO and RapidAPI gives the number of deaths and confirmed cases of coronavirus at the country and province level. The country and province data is text. To get that on a map we need the coordinates: the lats and longs.
To get the coordinates we need to fire this country-province text at a geocoding service.
There are several geocoding services available. I chose OpenCage.
Since the data returned from RapidAPI looks something like this:
"province": "New York",
"country": "US",
"lastUpdate": "2020-03-20T22:14:43",
"confirmed": 8310,
"deaths": 42,
"recovered": 0
The address here is basically "New York, US". This is what needs to be fired at OpenCage.
What I decided to do was run all my addresses against OpenCage just once. Then my app can consume the result as a static JSON file. This means I don't have to repeatedly query the geocoding service.
The following is the Node.js code I knocked up just to retrieve the coordinates. I used OpenCage's own Node.js module, but almost certainly could have got away with using plain http requests.
const opencage = require('opencage-api-client');
const addresses = require("./countries.js");


function getCoords(address, cb) {
    opencage.geocode({
        q: address,
        key: "API-KEY-FROM-OPENCAGE"
    }).then(data => {
        //console.log(JSON.stringify(data));
        if (data.status.code == 200) {
            if (data.results.length > 0) {
                var place = data.results[0];
                console.log(place.formatted);
                cb(address, place.geometry,place.formatted)
            } else {
                console.log("No results...");
                cb(address,{},"");
            }
        } else if (data.status.code == 402) {
            console.log('hit free-trial daily limit');
            console.log('become a customer: https://opencagedata.com/pricing');
        } else {
            // other possible response codes:
            // https://opencagedata.com/api#codes
            console.log('error', data.status.message);
        }
    }).catch(error => {
        console.log('error', error.message);
    });
}
You may notice that I've loaded a list of the countries that I needed to geocode using require. This is just an array of province-country pairs previously generated from a RapidAPI call. I then loop through this array calling the getCoords method for each pair.
I just ran this code once and wrote the result to a JSON file. This code, incidentally, is almost a complete copy of OpenCage's example Node.js (Forward geocode) code.
Bringing the Whole Lot Together
This is what I ended up with to generate the map:
$(function () {
//this is used to create different sized and coloured
//circles according to how many deaths there have been
let circleConfigs = {
51: {//less than 51
radius: 2,
color: 'green',
fillColor: '#00ff22',
fillOpacity: 0.5
},
101: { //less than 101
radius: 5,
color: 'blue',
fillColor: '#009dff',
fillOpacity: 0.5
},
201: {
radius: 10,
color: 'blue',
fillColor: '#009dff',
fillOpacity: 0.5
},
501: {
radius: 10,
color: 'magenta',
fillColor: '#FF00FF',
fillOpacity: 0.5
},
1001: {
radius: 10,
color: 'red',
fillColor: '#f03',
fillOpacity: 0.5
},
1000000: {
radius: 15,
color: 'red',
fillColor: '#f03',
fillOpacity: 1
}
}
//function called to assign circle config
//by the number passed
function getCircle(num){
let output = {
radius: 10,
color: 'red',
fillColor: '#f03',
fillOpacity: 1
};
for(key in circleConfigs){
if(num < key){
output = circleConfigs[key];
break;
}
}
return output;
}
//lookup object for coordinates
let geocodedAddresses = {}
//load the address list with corresponding coordinates
$.getJSON("/js/geocoded-addresses.json", function (data, status) {
data.forEach(function (item) {
//add the data to a dictionary style object
//so that it is easy to look up each address
geocodedAddresses[item.address] = {
formatted: item.formatted, // just a nicer looking address - incase we want it
geometry: item.geometry// lats & longs
}
})
});
//create map object and set default positions and zoom level
let map = L.map('map').setView([20, 13], 2);
L.tileLayer('https://{s}.tile.osm.org/{z}/{x}/{y}.png', {
attribution: '© <a href="https://osm.org/copyright">OpenStreetMap</a> contributors'
}).addTo(map);
//headers we need to pass to rapidapi
let opts = {
headers:{
"x-rapidapi-host" : "covid-19-coronavirus-statistics.p.rapidapi.com",
"x-rapidapi-key": "YOUR-API-KEY"
}
};
//REST service endpoint
let url = "https://covid-19-coronavirus-statistics.p.rapidapi.com/v1/stats";
let stats = [];
//call the service
$.ajax(url,opts).done(function (data, status) {
stats = data.data.covid19Stats;
//now create the circle markers
for (let i = 0; i < stats.length; i++) {
let item = stats[i];
let address = item.province + "," + item.country;
let geo = geocodedAddresses[address];
if (geo) {
if (geo.geometry && geo.geometry.lat) {
let txt = geo.formatted + "<br>Deaths: " + item.deaths;
let circle = getCircle(item.deaths);
L.circleMarker([geo.geometry.lat, geo.geometry.lng],circle)
.bindPopup(txt).addTo(map);
} else {
console.log("Missing geometry: " + address);
console.log(geo);
}
} else {
console.log("Missing: " + address);
}
}
});
});
You will notice that I've included some code to generate different sized and coloured circles according to how many deaths there have been. If you get the number breakpoints right it can really make a big difference on the map in identifying and illustrating the virus hotspots.
I'm intending to come back and tinker with the code as the days and weeks go by. With the current widespread self isolation this might be a useful occupation.